
Police logged 622 crime and anti-social behaviour reports within a mile of central Wymondham in the year to August, down 20%. Shoplifting fell from 116 to 40.
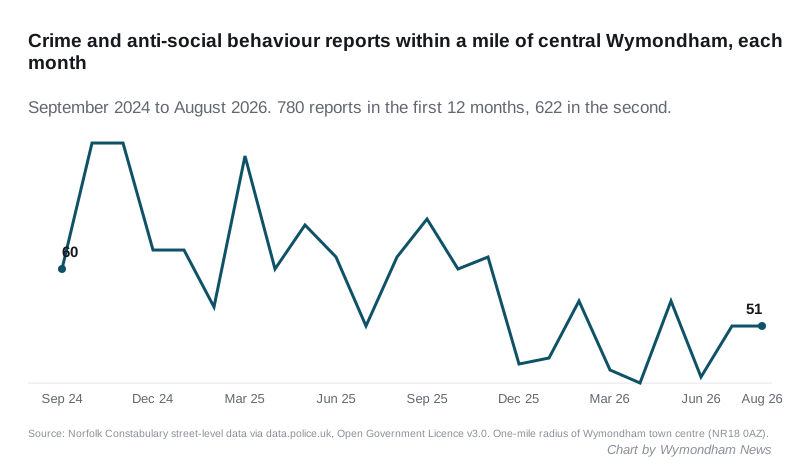
Police recorded 622 crimes and anti-social behaviour reports within a mile of Wymondham town centre in the 12 months to August 2026. In the 12 months before that, the figure was 780. That is a fall of 158 reports, or about 20%.
The biggest single change is shoplifting. It fell from 116 reports to 40, a drop of about two-thirds.
The figures are Norfolk Constabulary’s street-level records, published on police.uk. We counted every record the police.uk data service returns for a one-mile radius of the town centre, for each of the last 24 months. These are crimes recorded by the police, not convictions.
August on its own
August 2026 brought 51 reports, the same as July and 11 fewer than in August 2025.
- 38 were crimes and 13 were anti-social behaviour.
- Violence and sexual offences was the largest category, with 20 reports. This category covers everything from common assault and harassment to the most serious offences.
- Other theft came next, with 6, then criminal damage and arson with 4.
- Shoplifting accounted for 1 report.
The 13 anti-social behaviour reports were the most in a month since May, when there were 14.
Police.uk also records where each crime has got to. For August’s 38 crimes:
- 22 were still under investigation
- 9 were closed as “unable to prosecute suspect”
- 6 were closed with no suspect identified
- 1 ended in a local resolution
Month by month
Nine of the last 12 months were quieter than the same month a year earlier. September and February were busier, and July was level.
| Month | Year to Aug 2025 | Year to Aug 2026 |
|---|---|---|
| September | 60 | 68 |
| October | 80 | 60 |
| November | 80 | 62 |
| December | 63 | 45 |
| January | 63 | 46 |
| February | 54 | 55 |
| March | 78 | 44 |
| April | 60 | 42 |
| May | 67 | 55 |
| June | 62 | 43 |
| July | 51 | 51 |
| August | 62 | 51 |
| Total | 780 | 622 |
What went down, and what went up
Most categories fell. Two rose.
| Category | Year to Aug 2025 | Year to Aug 2026 |
|---|---|---|
| Violence and sexual offences | 325 | 295 |
| Anti-social behaviour | 93 | 104 |
| Criminal damage and arson | 69 | 51 |
| Other theft | 29 | 50 |
| Shoplifting | 116 | 40 |
| Public order | 62 | 30 |
| Other crime | 21 | 13 |
| Vehicle crime | 17 | 9 |
| Drugs | 9 | 8 |
| Possession of weapons | 4 | 6 |
| Robbery | 3 | 6 |
| Burglary | 21 | 5 |
| Bicycle theft | 10 | 3 |
| Theft from the person | 1 | 2 |
Leaving anti-social behaviour aside, recorded crime fell from 687 to 518, about 25%. Public order offences halved. Burglary fell from 21 to 5.
The rises are smaller in number but worth stating. Anti-social behaviour went up from 93 to 104. “Other theft”, which police.uk says includes theft by an employee, blackmail and making off without payment, went up from 29 to 50. Even counting that rise, the two theft categories together fell from 145 to 90.
Where the shoplifting fall happened
Police.uk does not publish the address of a crime. It pins each one to the nearest of a set of anonymised map points, and names the point after a street.
In the year to August 2025, 82 of the 116 shoplifting reports were pinned to the point police.uk calls “On or near Postmill Close”. In the latest year, that point had 11. The fall at that one spot accounts for almost all of the town’s drop in shoplifting.
Postmill Close is in NR18, within the radius. According to OpenStreetMap, the shops on it are the Morrisons supermarket and three small motor and electrical businesses. Because police.uk does not name premises, we cannot say that every report at that point came from one shop. The data also does not say why the numbers fell. A change in how incidents are reported or recorded can move a count as much as a change in offending.
What it means for you
- Wymondham’s recorded crime is lower than a year ago, across most categories, and the fall is not down to one unusual month.
- The figures are small. At around 50 reports a month, a handful of incidents can swing a monthly total, so judge the trend over a year rather than a single month.
- You can check your own street. Enter a postcode on police.uk to see the map for your area, and the neighbourhood team that covers it.
- Report crime to Norfolk Police online or on 101, or 999 in an emergency. A recorded report is what feeds these figures.
For more on the town, see our pages on Wymondham house prices, roadworks and travel and parking in Wymondham.
Source: Norfolk Constabulary street-level crime data for September 2024 to August 2026, via data.police.uk, Open Government Licence v3.0. Figures are for a one-mile radius of Wymondham town centre (NR18 0AZ) and are provisional; police.uk can revise past months.
Have your say